
Stellaris Section I Introduction REVISED_v2

Wright’s Law and the Accidental Revolution
How Energy, Transportation, Labor, and Connectivity Deliver the Abundance Economy Beyond the Reach of Central Governments
The Accidental Collaboration That Changes Everything
Washington never planned this. Beijing never planned this. And that’s precisely the point.
Right now, two geopolitical rivals locked in the most consequential technological competition in modern history — the United States and China — accidentally collaborating to deliver something no development program ever achieved. The prize: economic independence for billions of people historically kept dependent on central governments.
The irony runs deep. SpaceX launches Starlink constellations while Washington views Elon Musk with genuine ambivalence — celebrating his rockets, wincing at his politics, and struggling to categorize his ambitions. Chinese manufacturers produce solar panels, battery packs, and electric vehicles at price points that Western manufacturers cannot match while Washington layers tariff after tariff attempting to contain Chinese technological advance. Neither actor designed an outcome that benefits the developing world. Neither actor even noticed the collaboration happening.
Wright’s Law cared nothing for either rival.
Theodore Wright first documented the pattern in 1936: every time cumulative production of an aircraft doubled, manufacturing costs fell by a predictable percentage. The curve never stopped. Costs fell whether governments wanted them to or not, whether incumbents lobbied against disruption or not, whether the timing suited anyone’s geopolitical strategy or not. The law doesn’t negotiate with incumbents, doesn’t await policy permission — the law simply operates. Climate Interactive's 2025 peer-reviewed research confirms the human side of that equation: 77% of policymakers describe global climate scenarios as too complex to act on — not because data runs short, but because no tool translates threshold dynamics into decisions.
Tony Seba recognized something Wright never anticipated: when a Wright’s Law cost curve crosses a critical threshold, disruption stops being a prediction and becomes an economic inevitability. The question shifts from whether, to when — and that window closes faster than anyone in the disrupted industry finds comfortable.
This article makes one central argument: the abundance economy doesn’t spread through political intention. Wright’s Law operating simultaneously across energy, transportation, labor, and connectivity makes central government control of an economy permanently obsolete. Not through revolution. Not through reform. Through the unstoppable logic of cost curves crossing thresholds in sequence.
The abundance economy deserves a precise definition. The phrase does not describe a utopian ideology or a political program. The abundance economy names an economically inevitable outcome. When the essential technologies of modern life — electricity, transportation, physical labor, and information access — cross their cost thresholds, those technologies become commercially accessible to anyone with even limited purchasing power. Geography doesn’t matter. Institutional permission doesn’t matter. Abundance arrives not through wishing or hoping but because Wright’s Law made scarcity uneconomical.
Five Thresholds — One Convergence Window
Five independent Wright’s Law cost curves converge across the same seven-year window the Fourth Turning crisis climax closes: 2025 to 2032. Each threshold carries a specific parity crossover point — the moment when the abundance technology undercuts the extraction incumbent on pure economics, without subsidy or political favor. Each threshold draws intellectual origin from empirical cost data, not ideological projection.
The 2025 empirical record confirms projections Dorr and Seba published five years before any threshold crossed. In 2020, Dorr and Seba modeled 100% solar, wind, and battery systems under deliberately severe constraints: no electric vehicles, no subsidies, no technological breakthroughs, no demand management, no distributed energy resources. [Dorr & Seba, Rethinking Energy 2020–2030, RethinkX, 2020] They projected a further 70 percent decline in solar costs, 40 percent in wind, and 80 percent in lithium-ion batteries by 2030. BloombergNEF, IRENA, and Ember data confirm those trajectories through 2025. Battery cost declines outran even the conservative projections. The model stayed deliberately understated. Reality ran ahead anyway. Climate Interactive's 2025 cross-sector data reinforces that confirmation: 30 government policies, 14 corporate strategies, and 6 investment policies shifted in direct response to simulation-based threshold engagement — cascade effects that cost-curve mechanics predict but that analysts rarely measure at sector scale. That confirmation converts the five-threshold argument from assertion into empirical record.
Figure 1. Five Abundance Thresholds — Stacked Architecture. A1 (SWB Grid Parity) anchors the foundation; A5 (Connectivity Parity) closes the convergence window. Sources: Seba/RethinkX 2020; IRENA 2025; ARK Big Ideas 2026; CATL 2024.
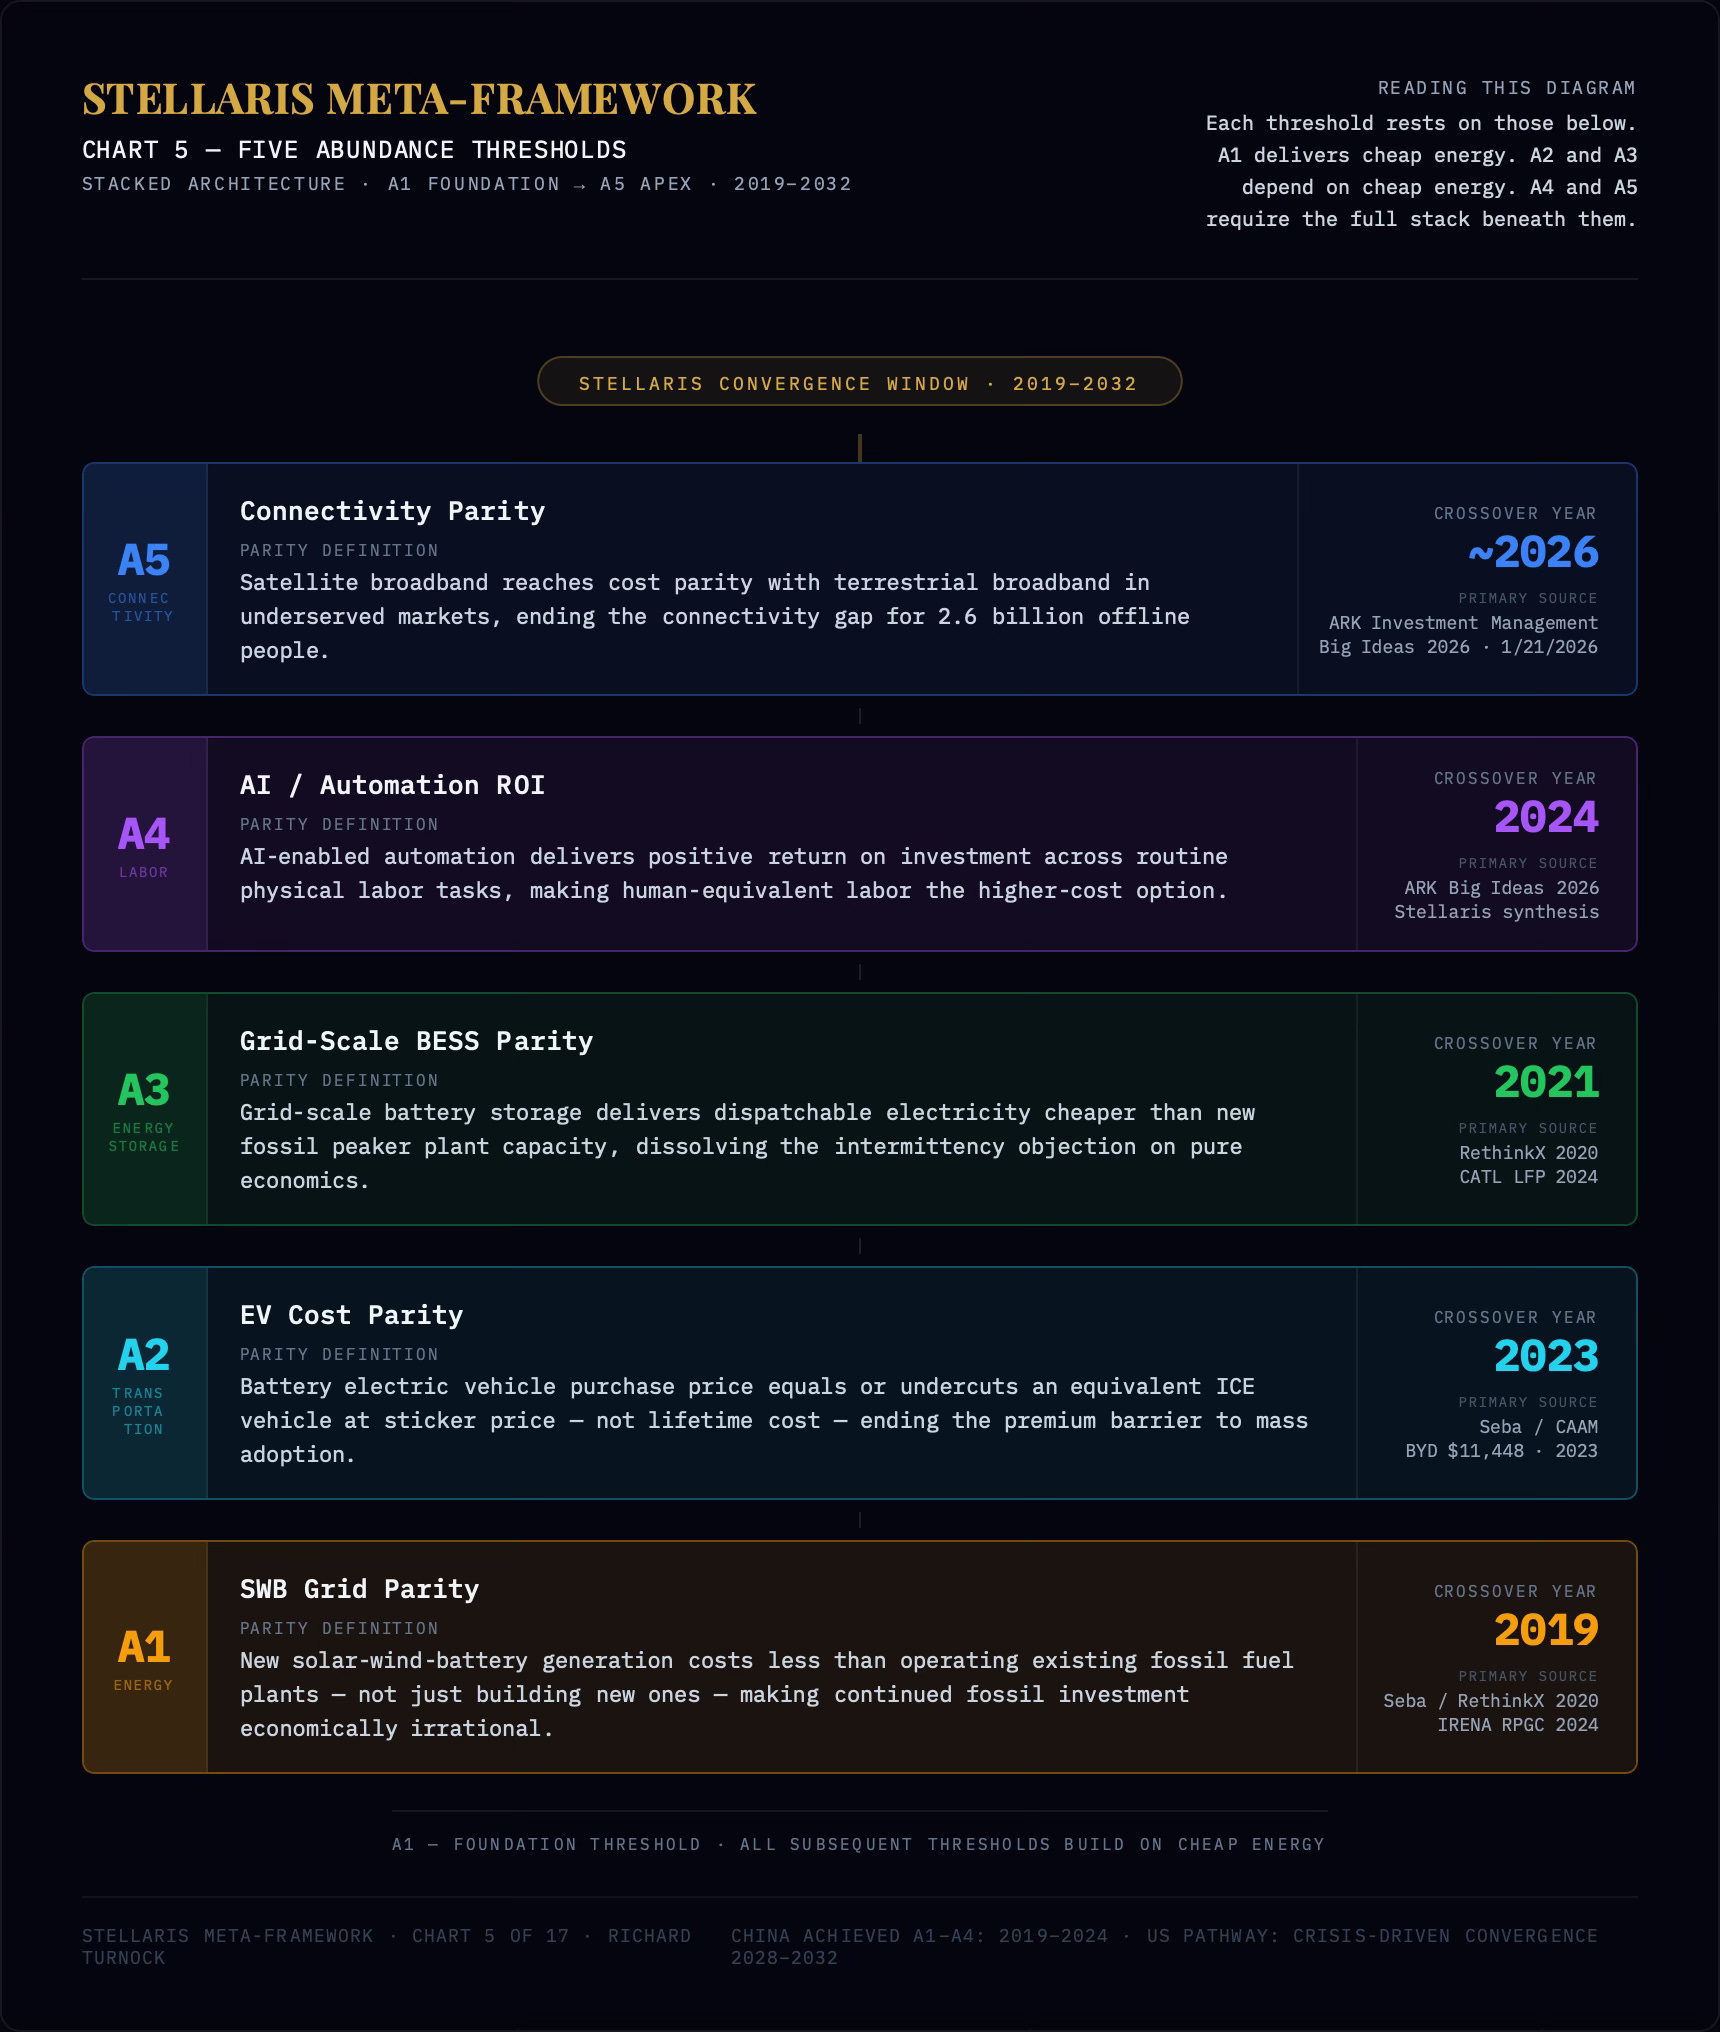
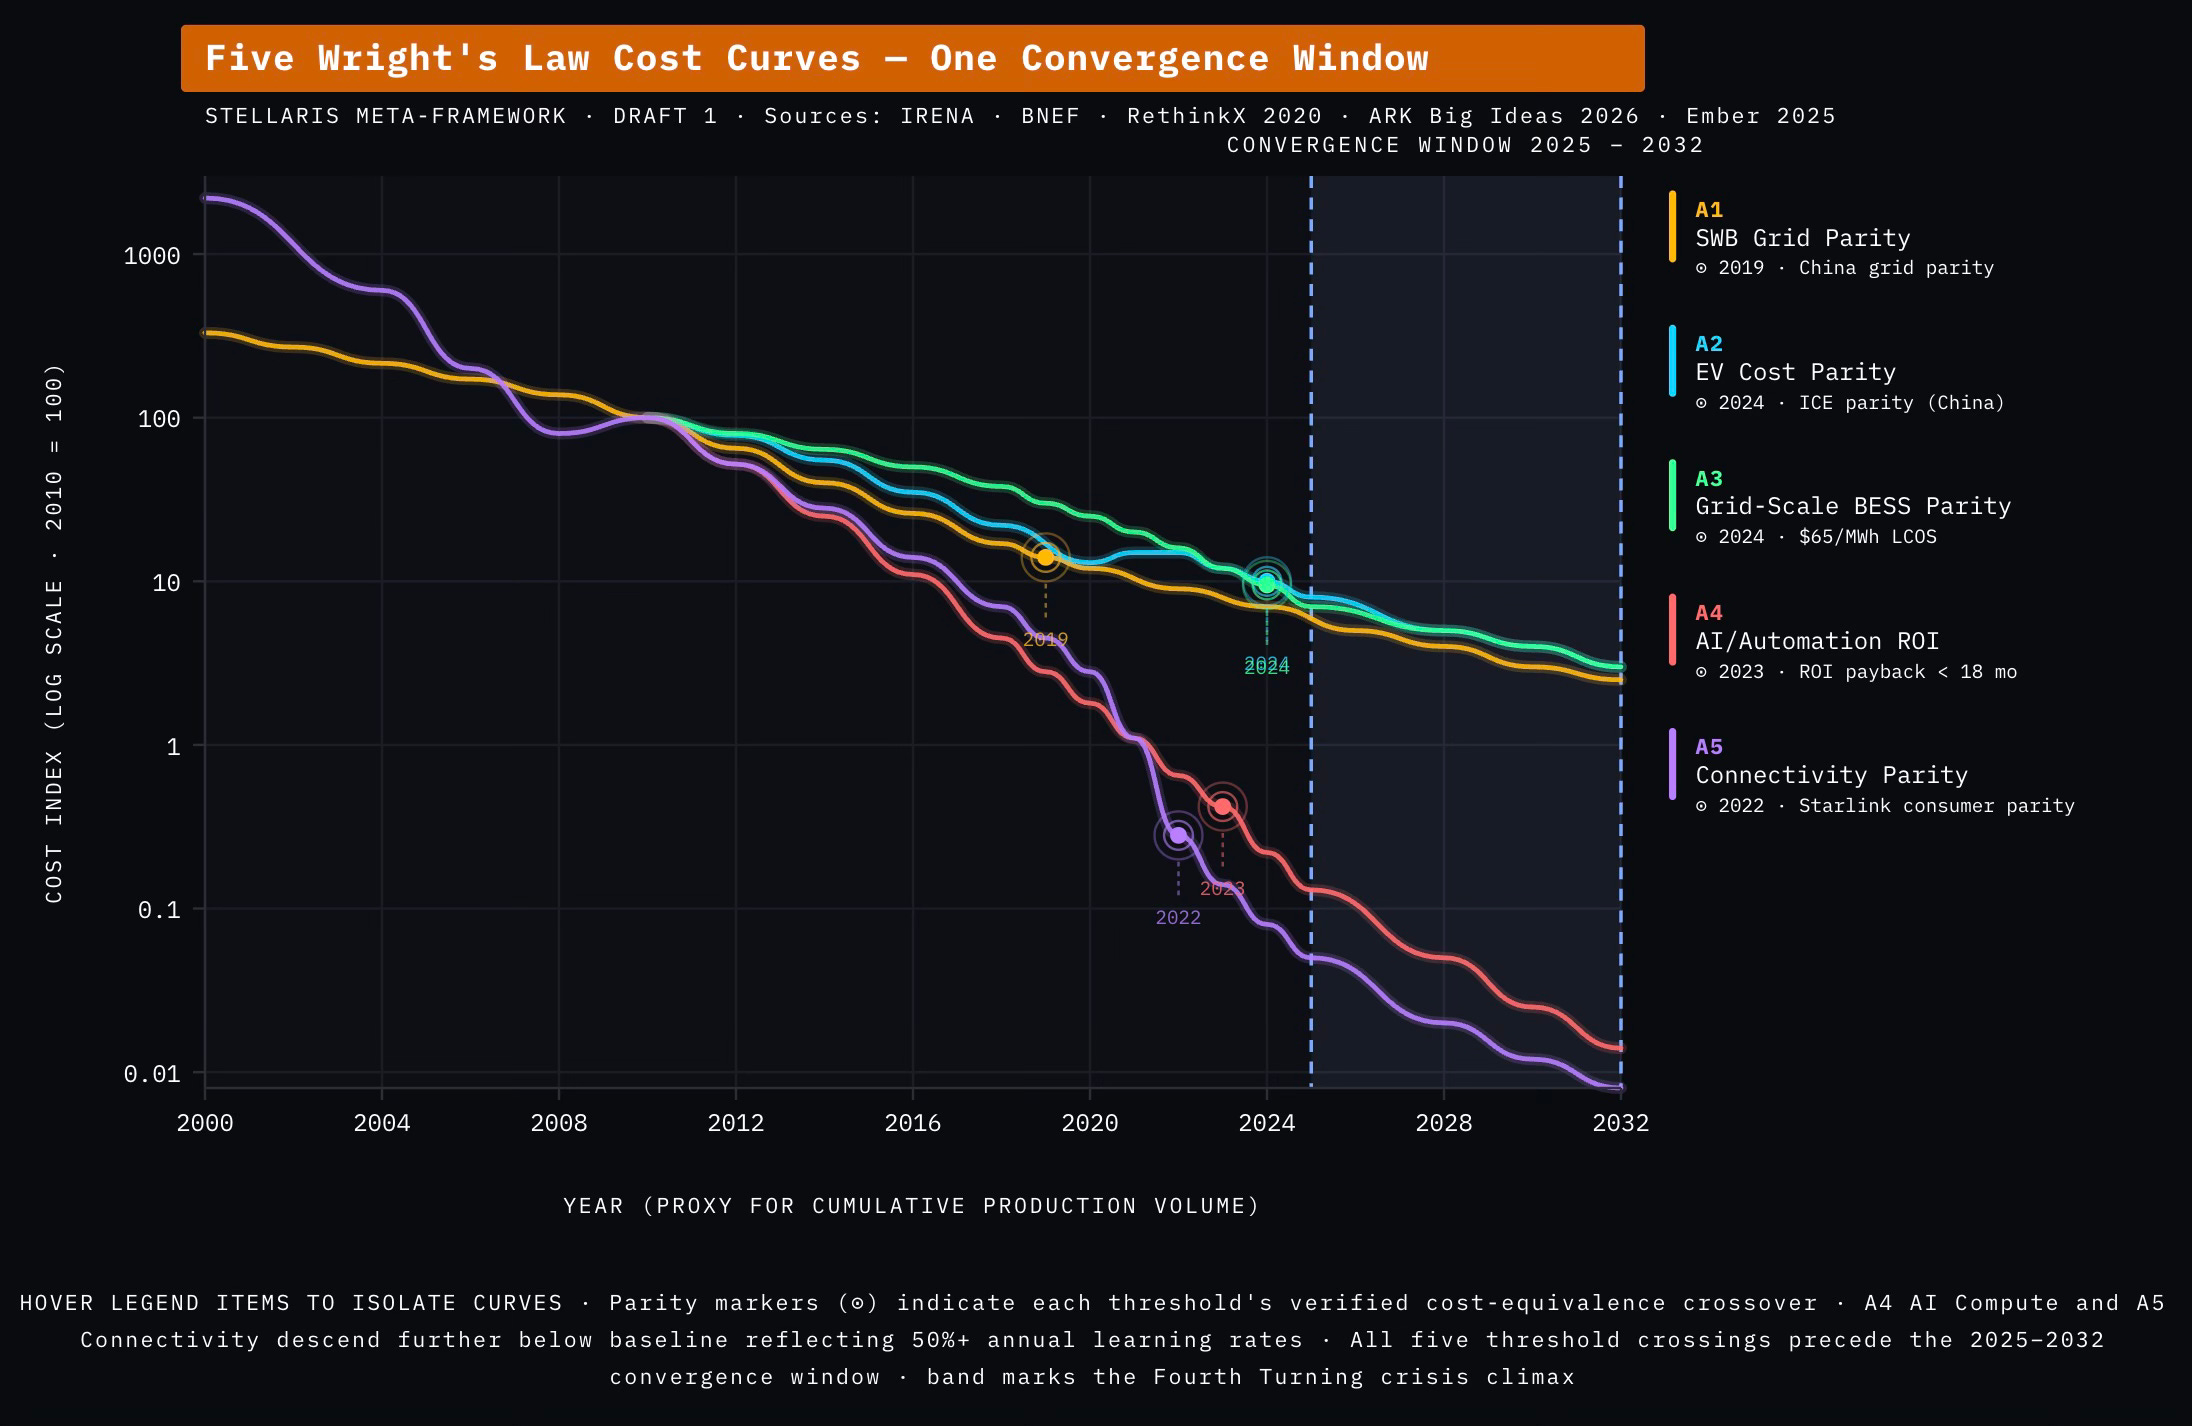
Figure 2. Five Wright’s Law Cost Curves — One Convergence Window
Each curve plots normalized cost against time as a proxy for cumulative production volume, with 2010 set to an index of 100 on a logarithmic scale. Five independent technologies — solar-wind-battery generation (A1), EV battery packs (A2), grid-scale BESS (A3), AI and automation compute (AI/Automation ROI) (A4), and satellite bandwidth (A5) — descend along separate Wright’s Law slopes at learning rates ranging from 18% per doubling for lithium-ion batteries to more than 44% per doubling for satellite bandwidth. Parity markers identify the verified year each threshold undercut the extraction incumbent on pure economics. All five crossings precede the shaded convergence window. The 2025–2032 band marks the Fourth Turning Crisis Climax Phase — the period when cost curves that already crossed parity collide with collapsing institutional resistance. The transformation releases not when the cost curves move, but when the institutional latches fail.
Seba’s Technology Disruption Framework
Abundance 1 — A1 SWB Grid Parity
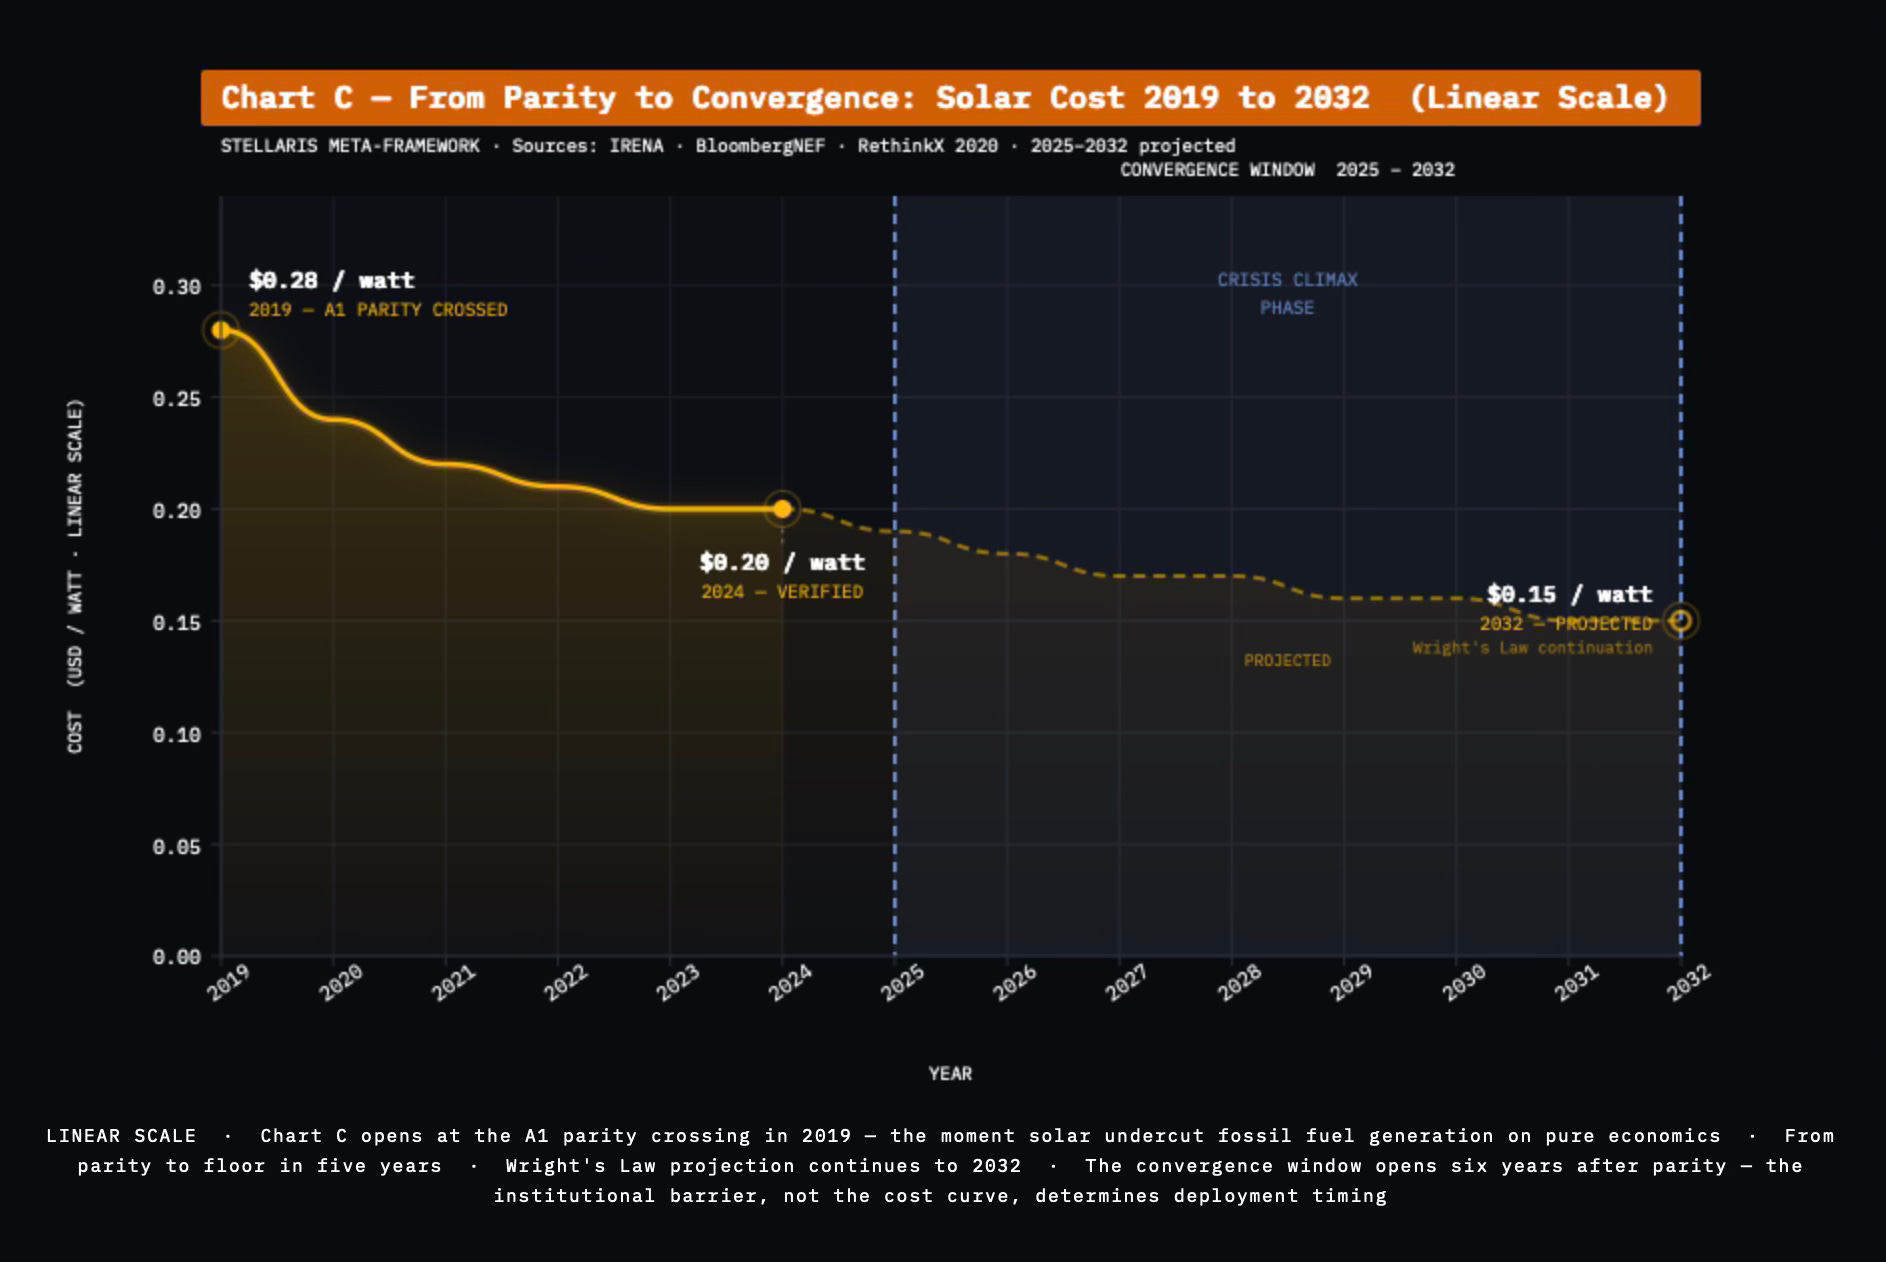
Tony Seba and Adam Dorr established the foundational thesis in Rethinking Energy 2020–2030: 100% Solar, Wind, and Batteries Is Just the Beginning [Dorr & Seba, RethinkX, 2020]. Solar photovoltaic power, wind power, and electrochemical batteries — the SWB system — converge to deliver electricity at costs that undercut every fossil fuel and nuclear alternative. The SWB system produces near-zero marginal cost electricity from stocks of durable assets rather than flows of combustible fuel, without air pollution, carbon emissions, or radiological risk. Solar costs have fallen more than 90% over the past decade. New solar-plus-storage capacity now costs less per kilowatt-hour than operating existing coal plants in most global markets.
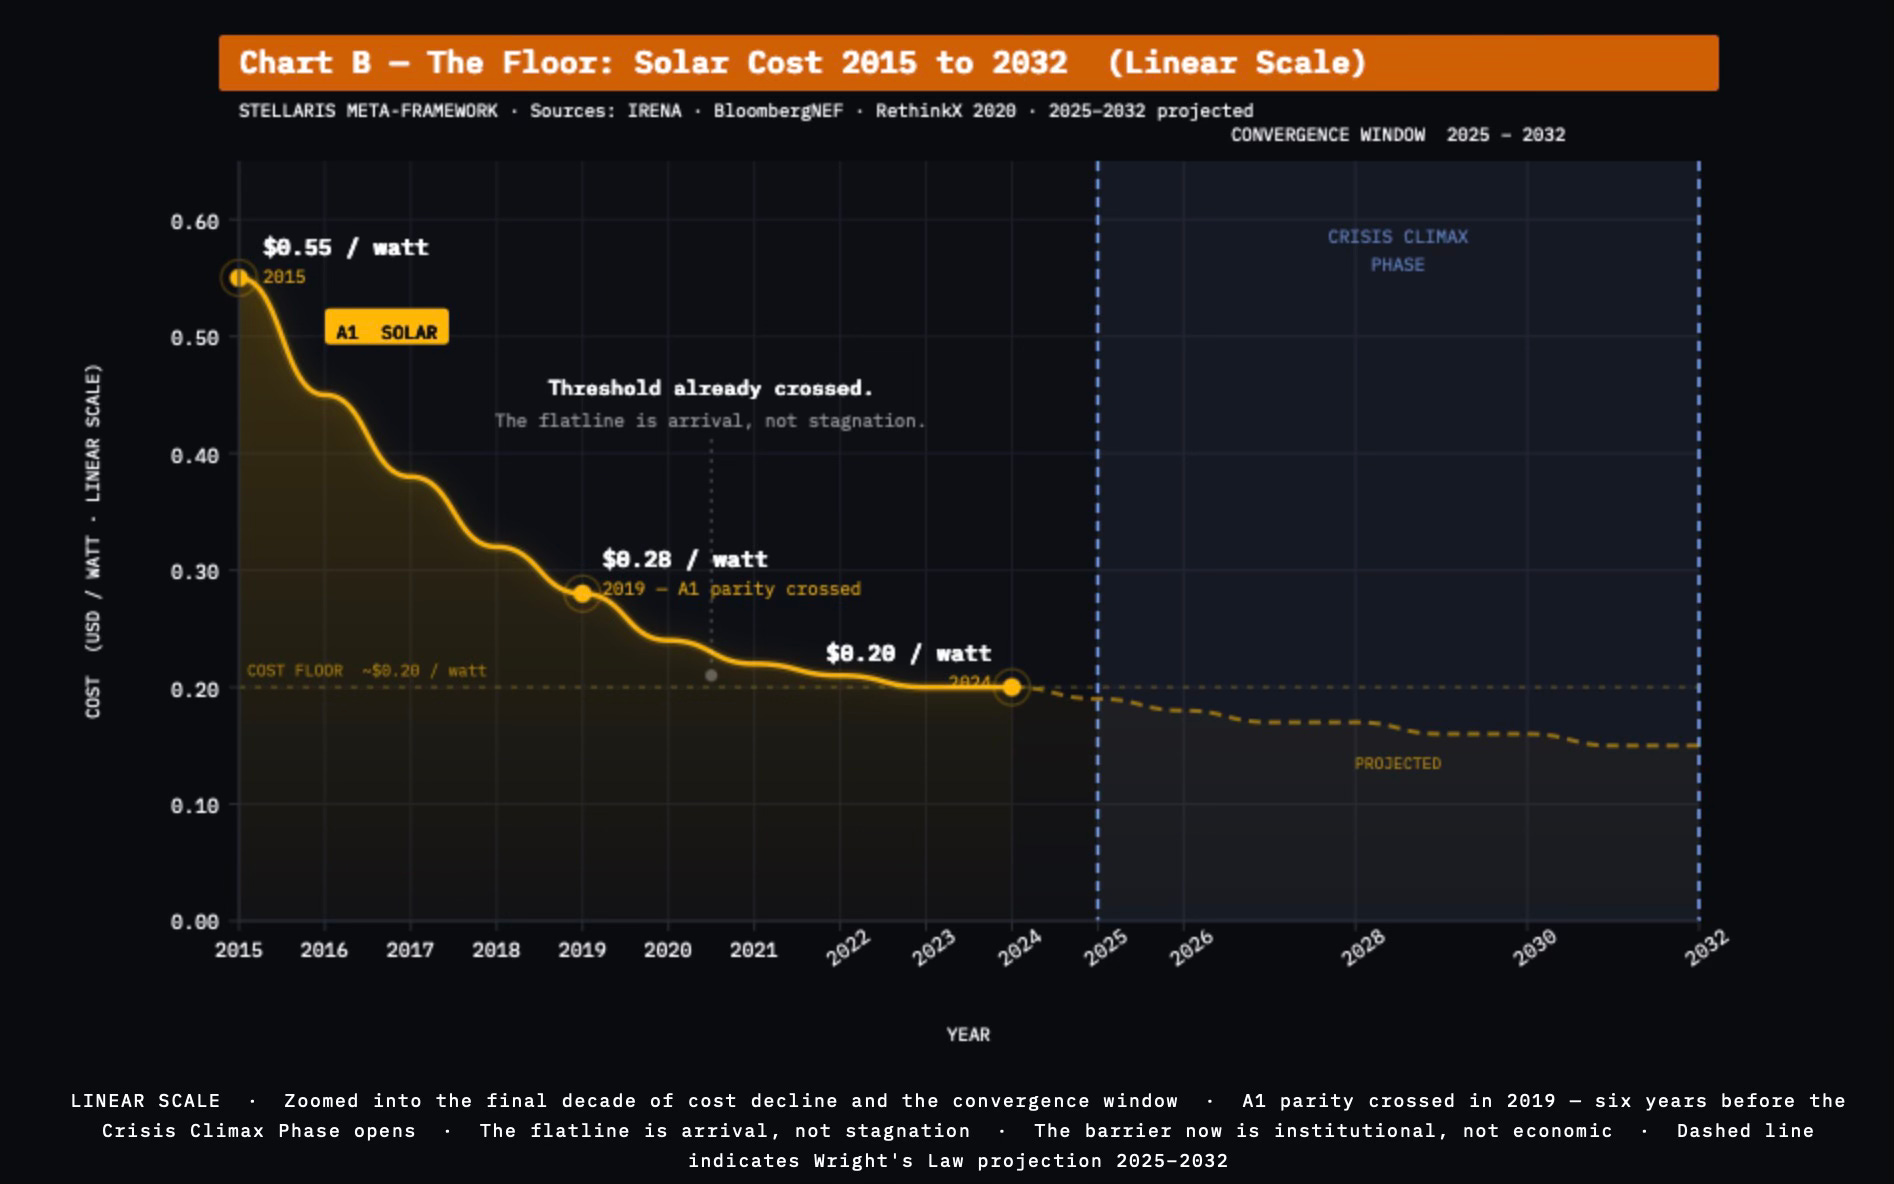
A village in rural Kenya today purchases electricity independence. Standalone photovoltaic systems. Solar mini-grids. No utility franchise. No government permission. Pure economics delivered the outcome that decades of development aid failed to produce. China’s manufacturing scale drove the cost curve faster than any Western projection anticipated, supplying 80% of the world’s solar panels and establishing SWB grid parity as documented fact rather than future projection. [Dorr & Seba, RethinkX, 2020]
Seba’s Technology Disruption Framework
Abundance 2 — A2 EV Cost Parity
Seba’s Technology Disruption Framework identified electric vehicles, autonomous driving, and Transportation-as-a-Service as the disruptive technologies that converge to make privately-owned internal combustion vehicles economically irrational. Battery cost curves follow Wright’s Law from $1,000 per kilowatt-hour toward $50 per kilowatt-hour. BYD now sells capable electric vehicles at $10,000–$12,000 in developing markets. No Western manufacturer matches the price. No government stops the purchase.
Sticker-price parity marks the moment EV purchase price undercuts internal combustion vehicles regardless of lifetime fuel savings. China crossed that line. Southeast Asia, Latin America, and Sub-Saharan Africa approach rapidly. When a vehicle charges from rooftop solar, the combined Abundance 1 plus Abundance 2 system delivers energy and transportation independence through straightforward commercial purchase, eliminating the petroleum supply chain dependency entirely. The two thresholds anchor every subsequent Abundance threshold: electricity and transportation represent the foundational requirements of economic participation in the modern world.
Seba Extended the SWB Thesis
Abundance 3 — A3 Energy Storage Parity
Seba extended the SWB thesis into grid-scale battery energy storage as a standalone disruption. Rethinking Energy 2020–2030 frames grid-scale batteries not merely as the storage component of Abundance 1 but as the threshold that makes 100% renewable grid penetration physically achievable — the solution to the intermittency problem critics long identified as solar and wind’s fatal weakness.
Grid-scale battery storage crosses the parity threshold when the cost per kilowatt-hour undercuts coal and natural gas peaker plants on pure economics. That threshold eliminates the last economic rationale for fossil fuel generation — the claim that dispatchable backup power requires combustion.
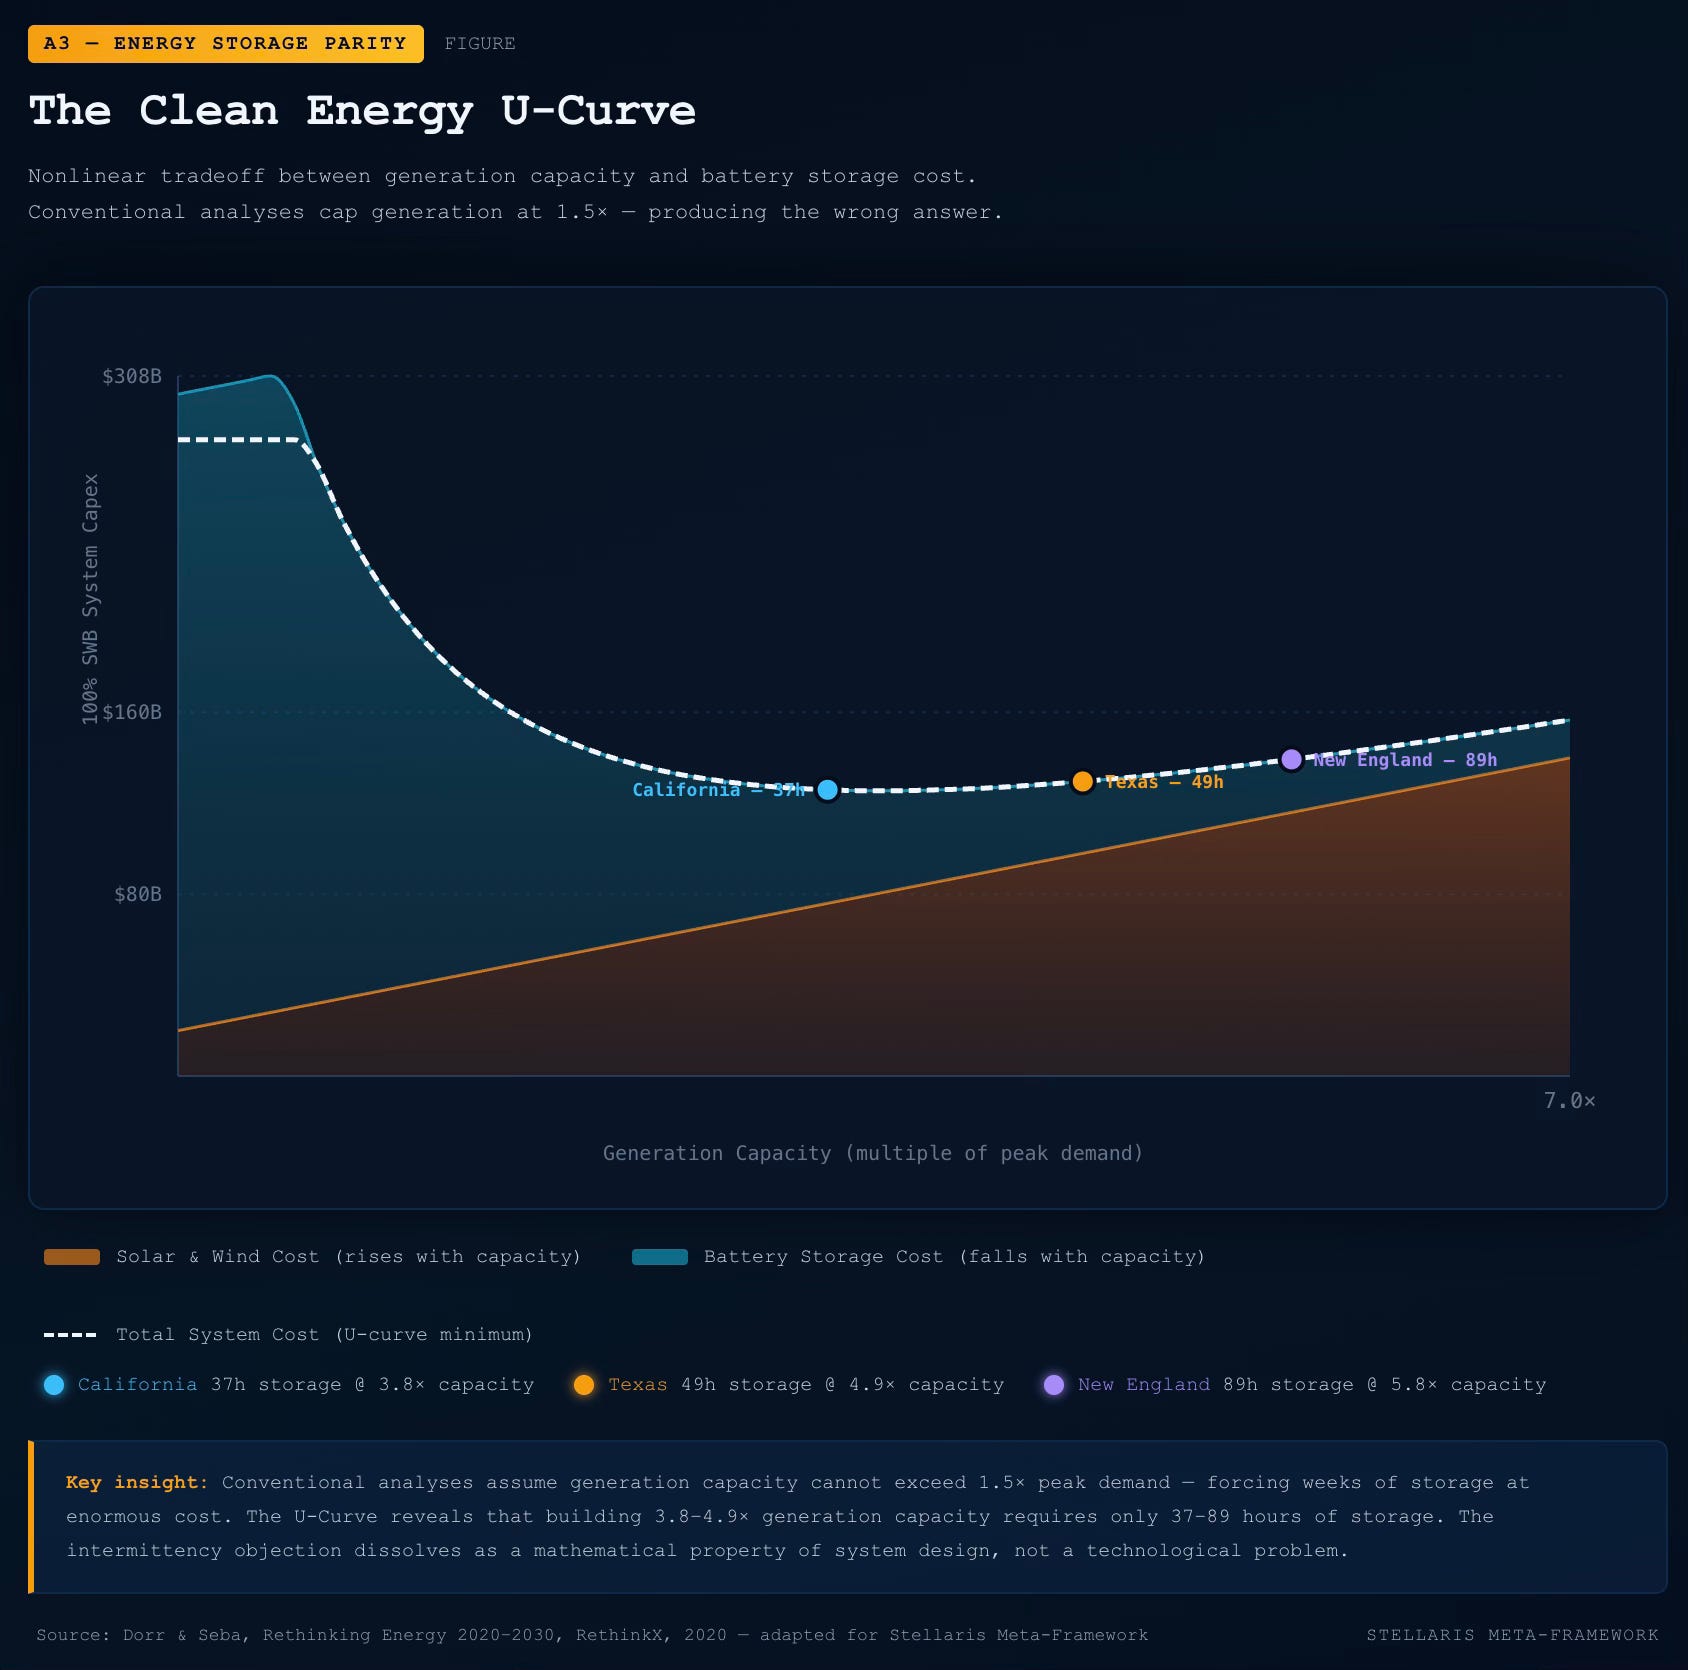
The most persistent objection to 100% renewable grid penetration rests on a modeling error. Conventional analyses rule out building more than 1.5 times current generation capacity. That constraint forces weeks of battery storage at enormous cost to cover intermittency. Dorr and Seba identified a fundamental nonlinear tradeoff between generation capacity and storage capacity: the Clean Energy U-Curve. [Dorr & Seba, Rethinking Energy 2020–2030, RethinkX, 2020] When generation capacity exceeds demand by 3.8 to 4.9 times, optimal system design requires only 35 to 90 average demand hours of battery storage. Not weeks. California’s optimal system requires 37 hours. Texas requires 49 hours. New England — the weakest solar resource in the continental United States — requires 89 hours. The objection dissolves as a mathematical property of system design, not through technological breakthrough. Build surplus generation capacity at falling costs. Store the remainder briefly at falling costs. The cost curves eliminate the objection before the critics finish raising the objection.
When grid-scale BESS undercuts peaker economics, stranded assets cascade through utility balance sheets. Virtual power plants (VPP) begin replacing centralized generation architecture. Each VPP aggregates distributed energy storage across thousands of commercial and residential installations. Storage makes intermittency irrelevant. The Strait of Hormuz becomes a geography lesson.
China cut lithium iron phosphate battery costs to $53 per kilowatt-hour by 2024 [CATL production data, 2024]. The number confirms Seba’s projected cost curve and grounds Abundance 3 threshold in empirical fact.
Clean Energy Super Power
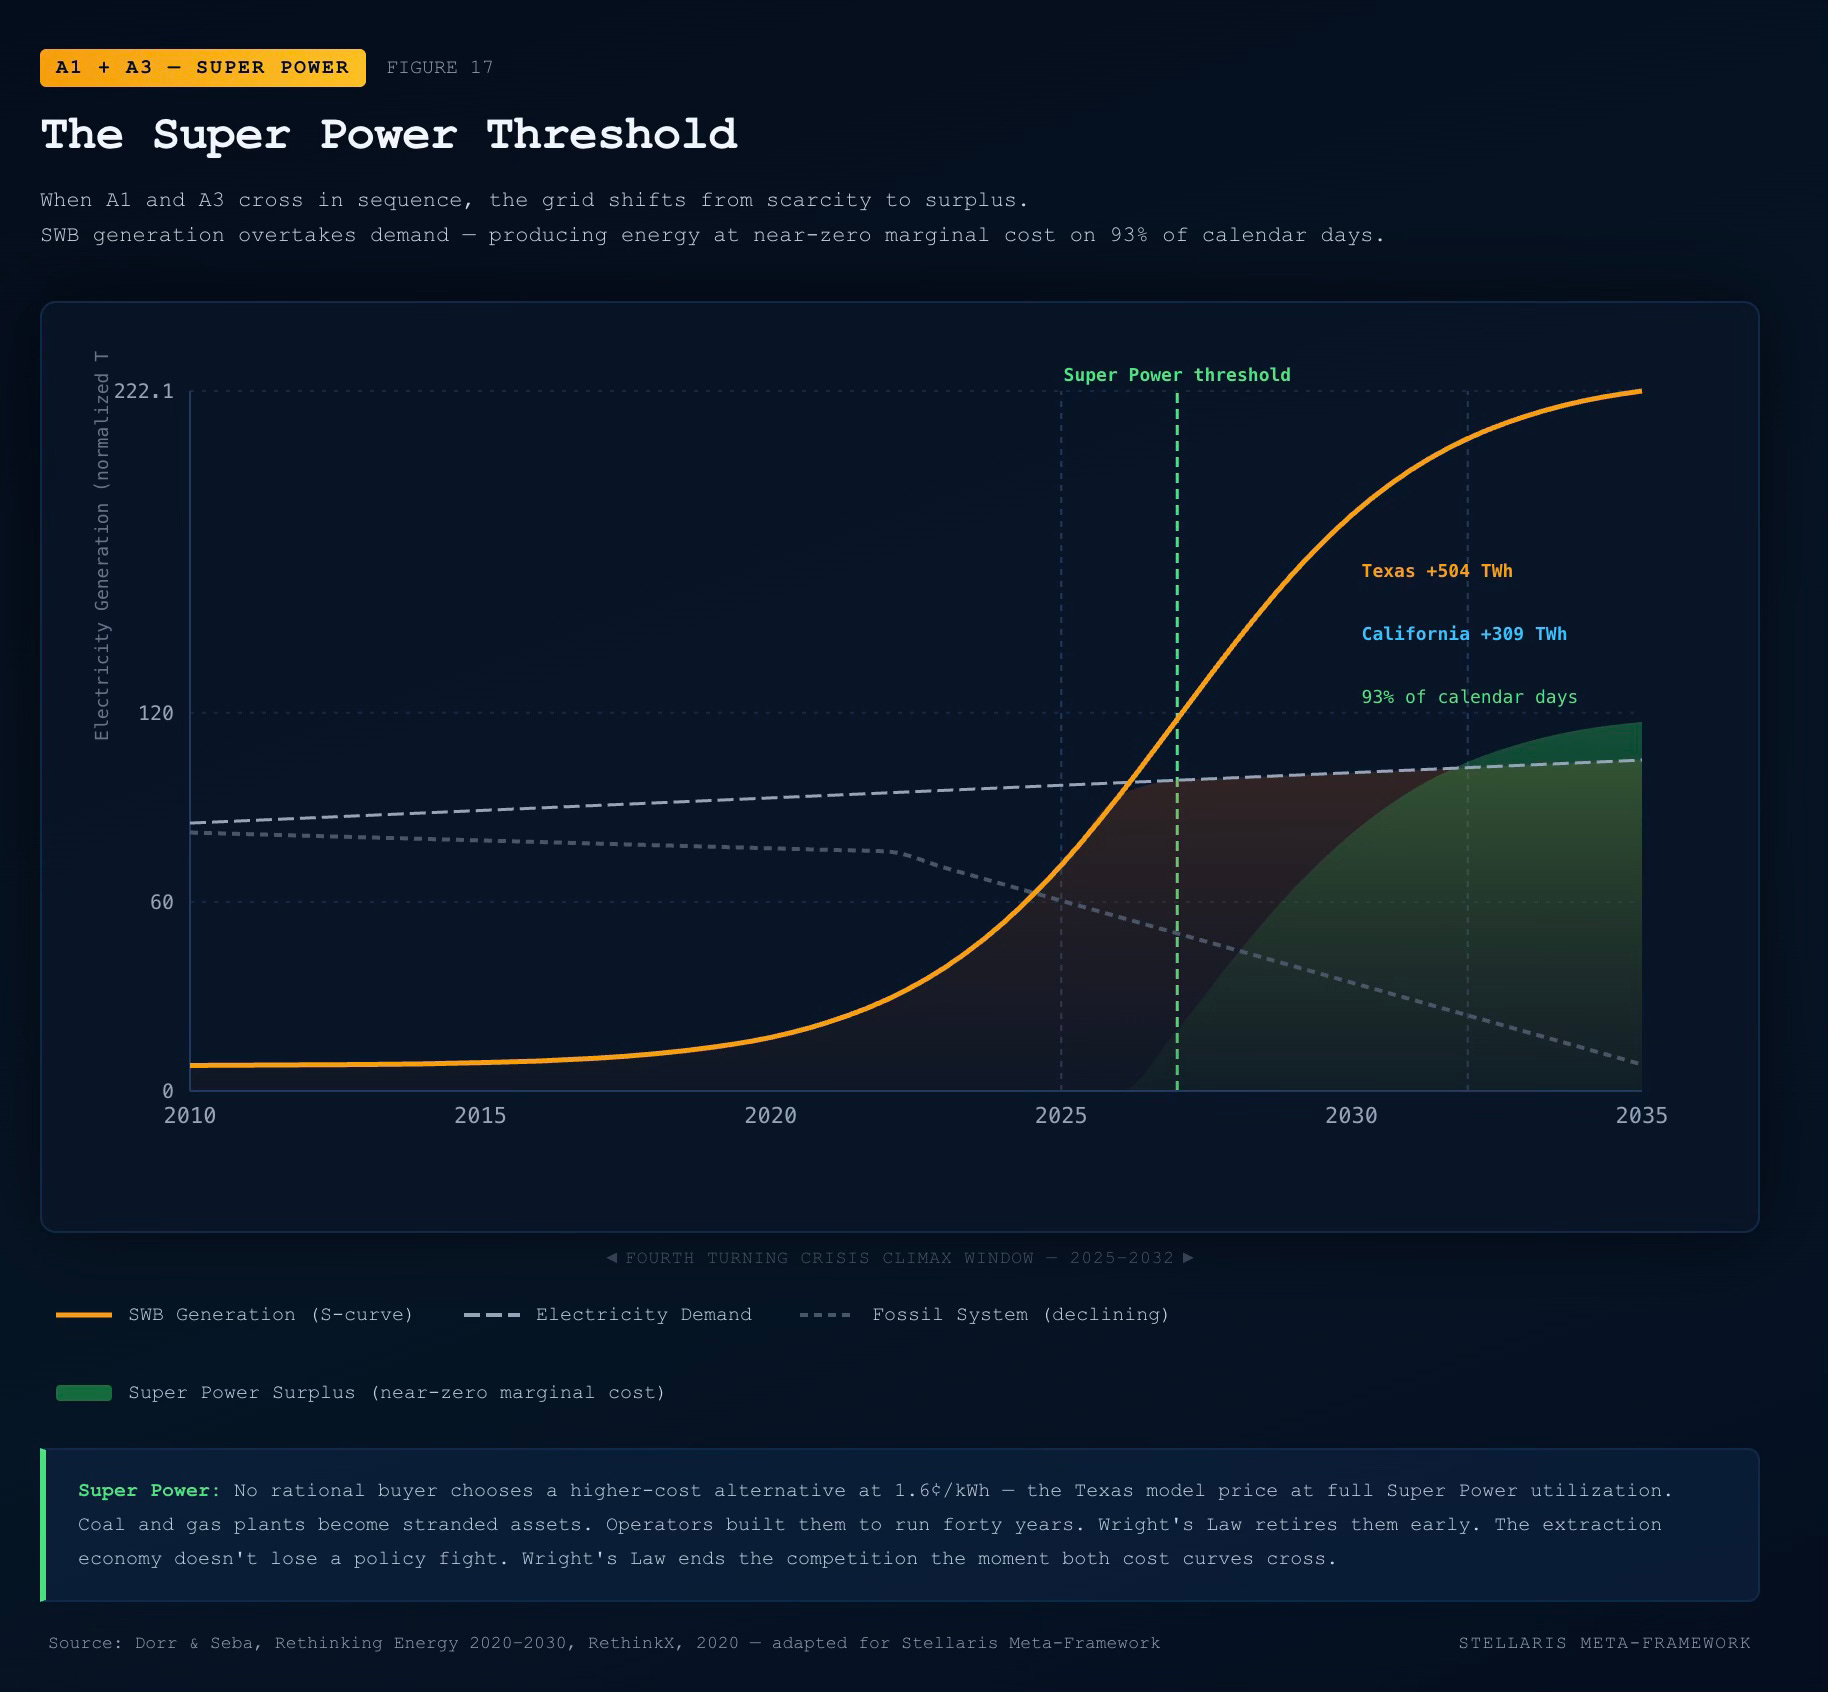
When A1 and A3 cross in sequence, the grid shifts from scarcity to surplus. A 100% SWB system produces surplus energy at near-zero marginal cost on most days of the year — what Dorr and Seba named Super Power [Dorr & Seba, Rethinking Energy 2020–2030, RethinkX, 2020]. They modeled a 100% SWB system for California. The model takes California’s measured electricity demand of 285 terawatt-hours as input and outputs 309 terawatt-hours of annual surplus, available on 93 percent of calendar days.
Dorr and Seba modeled a Texas SWB system generating 504 terawatt-hours of annual surplus on 93 percent of calendar days. Super Power prices fossil fuel generation out of the market regardless of policy. Coal and gas plants become stranded assets. Operators built them to run forty years. Wright’s Law retires them early. No government mandate drives those closures. No rational buyer chooses a higher-cost alternative at 1.6 cents per kilowatt-hour — the Texas model price at full Super Power utilization. [Dorr & Seba, Rethinking Energy 2020–2030, RethinkX, 2020] The extraction economy doesn’t lose a policy fight. Wright’s Law ends the competition the moment both cost curves cross.
The Final Scarcity Barrier
Abundance 4 — A4 AI and Automation ROI
A4 marks the threshold where the cost of AI-powered humanoid robotics undercuts human labor costs across manufacturing, agriculture, logistics, and service industries — the moment when deploying a humanoid robot delivers measurable returns that justify capital allocation at scale. This threshold represents the Stellaris framework’s original synthesis contribution rather than an extension of Seba’s prior work, and ARK Investment Management’s 2026 analysis provides independent engineering corroboration.
ARK maps the compute capacity that Tesla’s Full Self-Driving system consumes against measured performance gains and then projects that Optimus crosses human-level task proficiency around 2028 — conditional on sustained compute expansion and continued hardware advancement [ARK Investment Management, Big Ideas 2026, 1/21/2026; Tesla, Q3 2025 Update]. That projection traces training compute, not the inference chip running in the vehicle or Optimus. Tesla trains each successive FSD version on Cortex and Dojo custom silicon. Those data center systems, not the vehicle chip, drive the cost curve ARK maps. Training compute follows the same Wright’s Law cost curve that governs every other abundance technology the Stellaris framework tracks. By 2028, that data center draw reaches approximately 1,080 megawatts. Each successive training run at that scale produces a more capable model. ARK projects that the 2028 version crosses human-level task proficiency in physical robotics. The energy cost of reaching that scale declines along the same falling cost curve.
ARK’s FSD-anchored timeline for Optimus and the Stellaris Fourth Turning crisis-peak window converge on the same year through entirely separate analytical frameworks: one grounded in generational theory and disruption economics, the other in cumulative compute units and measured autonomous performance.
As production scales, current cost declines for Tesla Optimus, Figure, and Chinese competitors follow predictable Wright’s Law curves. Chinese humanoid robot manufacturers enter the same dynamic as solar and EVs — manufacturing volume drives cost curves faster than any Western analyst expects, and developing markets face no political constraint preventing purchase of the most affordable robot available.
When humanoid robot cost crosses the labor parity threshold, labor cost in manufactured goods approaches zero. Energy cost follows Wright’s Law toward the same floor. The robotic labor curve and the energy cost curve together eliminate two inputs that the extraction economy manufacturers historically priced as advantages. Land costs persist. Production equipment costs follow their own Wright’s Law decline as manufacturing scales. Both curves converge on the extraction economy’s margin structure and collapse that structure. Even regions lacking human labor pools gain full production capability. The final scarcity barrier dissolves.
Abundance 5 — A5 Connectivity Parity
A5 closes the remaining gap: Starlink’s satellite internet constellation follows the same price curve toward $30–$40 per month globally. ARK quantifies the mechanism — satellite bandwidth costs decline approximately 44% for every cumulative doubling of gigabits per second in orbit [ARK Investment Management, Big Ideas 2026, 1/21/2026]. That curve prices 2.6 billion people into the digital economy.
Rocket launch costs follow Wright’s Law with equal precision. ARK documents a 17% cost decline for every cumulative doubling of upmass to orbit [ARK Investment Management, Big Ideas 2026, 1/21/2026]. SpaceX cut launch costs 95% since 2008 — from approximately $15,600 per kilogram to under $1,000 per kilogram across 17 years of Falcon 9 operations. SpaceX targets $100 per kilogram at Starship scale. Reusability drives cumulative production volume. That mechanism mirrors exactly how EV battery costs fell from $1,000 per kilowatt-hour toward $50 per kilowatt-hour. Rockets qualify as a documented Wright’s Law disruption, not an aspiration.
Satellite bandwidth costs follow the same Wright’s Law curve as every prior threshold — ARK documents a 44% cost decline per cumulative doubling of gigabits per second in orbit [ARK Investment Management, Big Ideas 2026, 1/21/2026]. SpaceX operates more than 9,000 active Starlink satellites, representing 66% of all active satellites in Earth orbit. T-Mobile launched Starlink direct-to-cell data service in October 2025. ARK projects Starship V3 drives another bandwidth cost collapse by 2026.
The implication follows directly from the cost curve: AI optimization software requires only connectivity to deploy. No physical infrastructure beyond a receiver and a device separates a village microgrid in rural Nigeria from the same BESS optimization AI managing European energy markets. A5 doesn’t deliver solar panels, batteries, EVs, or robots. Connectivity removes the last geographic barrier to the AI optimization layer that makes each threshold perform at full capability.
The AI Architecture — Optimizer and Convergence Layer
Artificial intelligence operates across all five Abundance thresholds at two distinct levels that the framework treats separately. Neither level qualifies as a numbered Abundance threshold, because AI never hits a single consumer-facing parity crossover the way SWB, EVs, BESS, humanoid robots, or satellite connectivity do. AI functions instead as the accelerant that compresses every threshold’s timeline.
AI as Optimizer embeds within each threshold individually. AI forecasts solar output and optimizes grid dispatch in A1. Full Self-Driving training happens on the world’s largest real-road dataset, sharpening autonomous judgment with every mile driven in A2. Artificial intelligence manages BESS arbitrage, grid stabilization, and demand forecasting in real time in A3. AI trained for humanoid robot’s tasks through hands-on work and spatial reasoning in A4. AI routes Starlink bandwidth and manages satellite constellation operations in A5. Inside each prior threshold, AI optimization loops generate training data with every cycle. Each improved model version cuts the cost floor further. The cost curve drops faster than Wright’s Law alone predicts.
AI as Convergence Accelerant operates across all five thresholds simultaneously as the Stellaris Convergence Layer. Each AI system generates training data that improves AI performance across all other thresholds. FSD compute scaling produces insights that accelerate humanoid robot training in A4. BESS optimization AI produces grid management patterns that improve solar forecasting in A1. The feedback loop compounds: faster AI improvement accelerates all five cost curves, generating more data, and accelerating AI further. ARK’s Convergence Network Strength metric rose 35% in 2025 alone, with AI remaining the critical enabling platform [ARK Investment Management, Big Ideas 2026, 1/21/2026]. That single-year acceleration signals the Stellaris Convergence Layer already activating.
Three Phases of Civilizational Transformation
The five Abundance thresholds, the two-level AI architecture, and the emerging space infrastructure stack form three distinct phases of the same civilizational transformation operating across different timescales. The phases overlap deliberately — each begins before the prior one completes, because cost curves don’t wait for institutional permission.
Phase 1 — Terrestrial Thresholds (2019–2032): Abundance 1 through Abundance 5 cross in sequence. Each threshold reinforces the others. Together they deliver abundance to anyone with commercial purchasing power regardless of geography. China validates A1 through A4 — crossing all four manufacturing thresholds between 2019 and 2024 through state-directed coordination. A5 crosses through SpaceX and the Starlink constellation — an American contribution China neither licenses nor replicates at comparable scale.
China responds with Guowang and Qianfan, state-controlled constellations that follow the same Wright’s Law cost curve while preserving sovereign information control. The developing world faces a choice that technology for A1 through A4 never presented: connectivity through a state-controlled stack or connectivity outside sovereign jurisdiction entirely. The Fourth Turning crisis climax drives American deployment at institutional scale during the 2028–2032 window.
Phase 2 — Convergence Acceleration (2025–2035): The Stellaris Convergence Layer activates as AI operates simultaneously across all five thresholds and generates compound feedback that compresses every timeline beyond what any single threshold predicts. The five thresholds stop operating as independent cost curves and start operating as a reinforcing system.
Phase 3 — Orbital Abundance Platform (2030–2040): Starship achieves the launch frequency and cost floor — ARK projects $100 per kilogram at scale — that makes orbital solar and space-based AI compute economically viable. [ARK Investment Management, Big Ideas 2026, 1/21/2026] This role differs from Starship’s A5 function as Starlink launch vehicle. A5 uses Starship to drive bandwidth costs down inside Phase 1. Phase 3 uses Starship to place energy generation and compute infrastructure beyond sovereign jurisdiction entirely. The populations still living inside extraction economies in 2030 gain access through a delivery stack no central government can reach.
The Stellaris framework describes Phase 1 comprehensively and Phase 2 as the active convergence mechanism. Phase 3 sits at the tail of the crisis window and just beyond, but represents the logical consequence rather than a speculative addition — the forward horizon that the crisis transformation builds the launchpad toward. The Fourth Turning crisis doesn’t merely transform Earth-based institutions. The crisis builds the foundation that launches the next civilization-scale S-curve.
The Fourth Turning Crisis Climax — Activation Energy for Inevitable Transformation
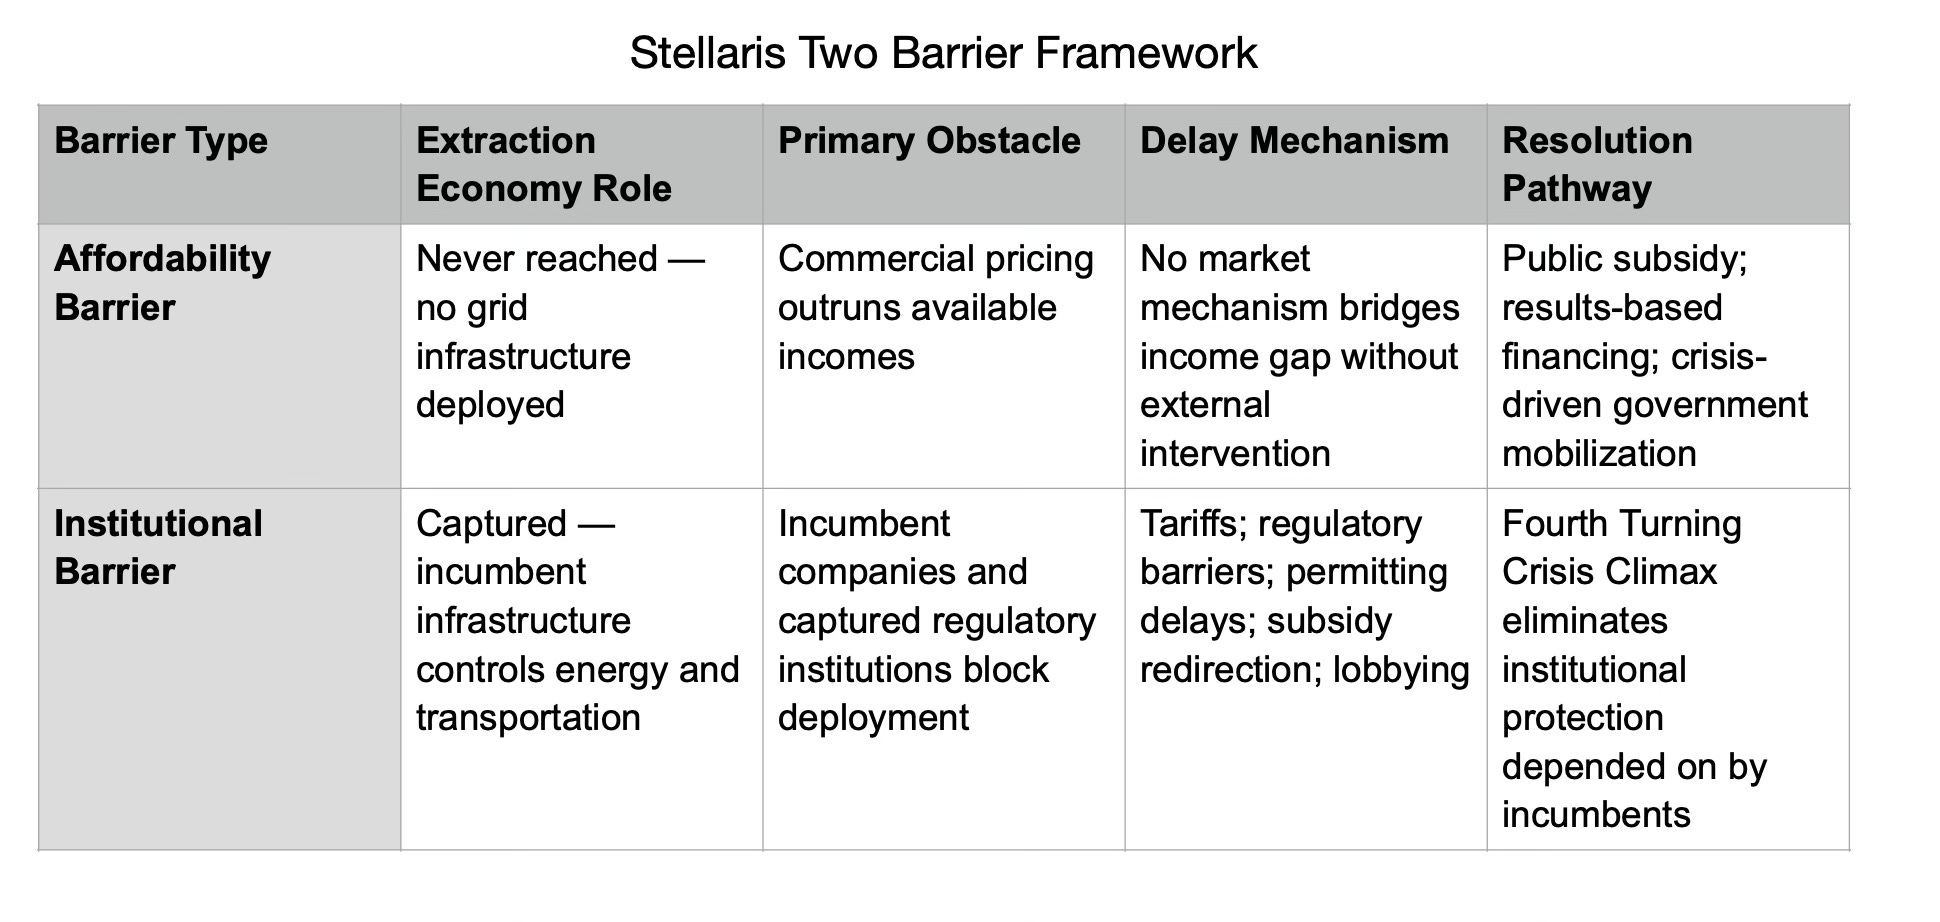
The abundance economy faces two distinct barriers operating through entirely different mechanisms. Nations that the extraction economy never reached confront an affordability barrier — the technology exists, the supply chain delivers, but commercial pricing still outruns the incomes of the billions of people that grid infrastructure never reached. Nations that the extraction economy captured, confront an institutional barrier — populations with the money and willingness to convert to the abundance economy face incumbent companies and captured regulatory institutions that delay deployment at every available leverage point.
Climate Interactive's 2025 programs in India, Indonesia, and Brazil demonstrate the mechanism in operation — capacity-building tools that move middle-income decision-makers from awareness to policy adoption within a single engagement cycle. (The CI material does not touch the Wright's Law cost-curve mechanics — those stay grounded in Dorr, Seba, ARK, CATL, and IRENA. CI enters specifically at the three points the document currently treats abstractly: the cognitive barrier that slows adoption, the real-world behavior of the affordability barrier in middle-income countries, and the empirical confirmation that 2025 marks an actual Crisis Climax activation rather than a theoretical one.)
Neil Howe’s Fourth Turning generational theory adds a dimension Seba’s economics alone cannot capture. Howe’s model identifies a Fourth Turning Crisis Era, now running 2008 to 2032, as the prolonged period of institutional delegitimization, generational conflict, and forced transformation that follows the unraveling of the prior civic order [Howe, The Fourth Turning Is Here, 2023]. Within that Crisis Era, Howe identifies a Crisis Climax Phase beginning in 2025: the period of maximum institutional stress, accelerated transformation, and forced resolution. Climate Interactive's 2025 Impact Report documents that stress activating: policy reversals in the United States and beyond dismantled data infrastructure and long-standing climate safeguards during 2025 — precisely the institutional unraveling the Crisis Climax Phase predicts. (The CI Report argues that economically irresistible alternatives accelerate institutional abandonment. The CI study provides empirical evidence that accessible systems-level tools produce durable behavioral change — the human threshold dynamic that mirrors the economic one.)
Populations abandon failing institutions faster when viable alternatives exist. A peer-reviewed study in Nature's Communications Earth & Environment found that participants in Climate Interactive's simulation-based experiences took climate actions lasting months after a single engagement — behavioral durability that information campaigns alone do not produce.Wright’s Law makes those alternatives not merely viable but economically irresistible — cheaper than the incumbent technology, available without institutional permission. The Crisis Climax Phase removes incumbent resistance at precisely the moment cost curves cross their critical thresholds. Political resistance, incumbent lobbying, and regulatory delay create friction and impose costs, but none of those forces can reverse cost curves that have already crossed parity.
The Stellaris framework argues that technological convergence landing inside the Crisis Climax Phase drives transformation — the timing doesn’t merely coincide, the timing causes the outcome. Wright’s Law locks the abundance economy into inevitability. The Crisis Climax Phase renders adoption irresistible. Technological cost curves and generational crisis dynamics don’t simply coincide. They bond. Each amplifies the other.
The result exceeds what either force generates alone.
Future Substack posts trace each Abundance threshold through the cost curve mechanics, examine the manufacturing engine driving those curves, and map the convergence dynamics compressing 2025–2032 into the most consequential transformation period in modern economic history. Central governments maintain political control by monopolizing infrastructure. The abundance economy ends the control and monopoly together. Not through political defeat. Through commercial obsolescence.
The abundance economy arrives because Wright’s Law doesn’t ask permission.
Key Sources Referenced in This Section
[Dorr & Seba, RethinkX, 2020] — Rethinking Energy 2020–2030: 100% Solar, Wind, and Batteries Is Just the Beginning
[ARK Investment Management, Big Ideas 2026, 1/21/2026] — cited for Wright’s Law on satellite bandwidth costs, rocket launch cost trajectories, Optimus compute scaling projection, and Convergence Network Strength data
[Howe, The Fourth Turning Is Here, 2023] — generational archetype alignment and Crisis Climax Phase identification
[Chinese LFP battery cell costs]— LFP battery cost at $53/kWh
[Climate Interactive, 2025 Impact Report] — cited for policymaker complexity data (77%), cross-sector cascade effects, middle-income country deployment case studies, and peer-reviewed behavioral durability findings.